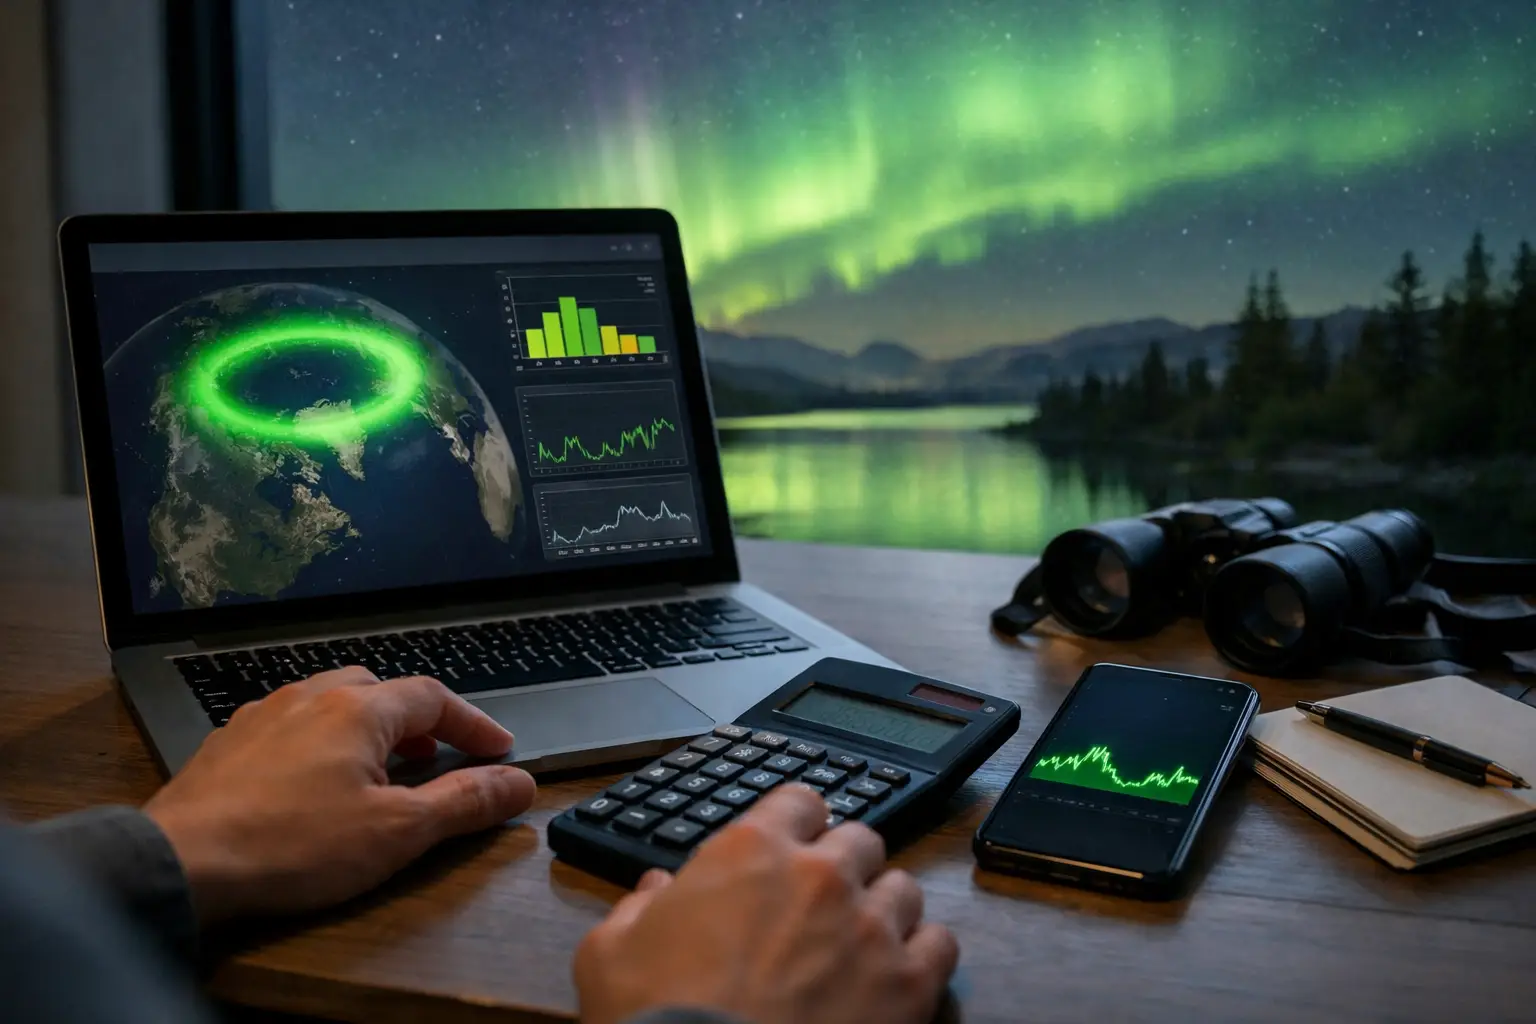
A high KP number can look exciting and still lead to a disappointing night under solid cloud. A modest display can become unforgettable when the sky clears, the IMF turns south, and you are standing somewhere dark with a clear northern horizon. To calculate live aurora score in a useful way, you need to combine space weather with the conditions above your exact location.
That is the difference between an aurora forecast that creates curiosity and one that helps you decide whether to leave your hotel, join a tour, or keep driving toward clearer skies. The Northern Lights are not controlled by one number. They are the visible result of solar activity meeting Earth’s magnetic field, then competing with clouds, moonlight, weather, geography, and timing.
What a Live Aurora Score Should Measure
A live score is a practical visibility estimate, not a promise. It answers a traveler’s real question: based on what is happening now, how worthwhile is it to watch the sky from this place tonight?
The score should give significant weight to two different categories. The first is aurora potential: whether energy from the Sun is entering Earth’s magnetic environment in a way that can produce visible activity. The second is viewing potential: whether you can actually see that activity through the atmosphere from your location.
If either category is poor, the final opportunity drops. Strong solar wind does not matter much beneath 100 percent cloud cover. Perfectly clear skies are equally frustrating when geomagnetic conditions are quiet and no aurora is present. A sensible live score brings both sides together instead of treating the KP Index as the whole story.
The solar inputs: speed, density, and IMF Bz
Solar wind is the stream of charged particles flowing outward from the Sun. Faster solar wind can carry more energy toward Earth, but speed alone is not enough. Density also matters, because a denser stream can increase the pressure on Earth’s magnetic field. A sudden rise in density may create a short-lived burst of activity, especially when other conditions are favorable.
The most watched directional measurement is IMF Bz, the north-south component of the interplanetary magnetic field. When Bz points south, shown as a negative value, it connects more effectively with Earth’s magnetic field. That connection allows solar energy to enter the magnetosphere more easily and can strengthen aurora activity.
A strongly negative Bz is encouraging, but context matters. A brief dip to negative values may not last long enough to produce a major visible response. Sustained southward Bz, paired with elevated solar wind speed or density, is generally more meaningful than a single dramatic reading. Conditions also take time to propagate through the system, so the sky may respond after the measurements change.
KP Index: useful context, not the full forecast
The KP Index describes global geomagnetic disturbance on a scale from 0 to 9. It is helpful for understanding how far south the auroral oval may expand and how active the overall magnetic environment has been. In northern Iceland, northern Norway, Finnish Lapland, and other high-latitude destinations, visible aurora can occur at low KP values when local skies are dark and clear.
KP is also averaged over a three-hour period. That makes it valuable as a broad indicator, but less suitable as a minute-by-minute viewing decision tool. A live score should use KP as one input among several, not let it overrule real-time solar wind, Bz, and local sky conditions.
A Practical Method to Calculate Live Aurora Score
You do not need to build a scientific model from scratch while standing beside a rental car in the cold. But understanding the logic helps you interpret any dashboard and avoid common mistakes.
Start with an aurora activity component. Look at solar wind speed, density, IMF Bz, and recent geomagnetic activity. Higher solar wind values, stronger density pulses, and sustained negative Bz should raise the activity estimate. Neutral or positive Bz should lower it, particularly when solar wind is slow and geomagnetic conditions are quiet.
Next, apply a local visibility component. Cloud cover should be the largest factor here because thick clouds block the view completely. Pay attention to low, middle, and high cloud when that information is available. A forecast that says partly cloudy can still be poor if a continuous low cloud deck sits directly above you, while scattered high cloud may leave plenty of visible sky.
Then account for weather at ground level. Fog, snowfall, rain, blowing snow, and haze can weaken or erase faint aurora even when a general cloud forecast appears acceptable. Wind direction and road conditions matter too, especially for independent travelers in Iceland, northern Norway, Alaska, or northern Canada. The best sky is not worth taking unsafe roads to reach it.
Finally, adjust for darkness and moonlight. The aurora is visible only when the sky is dark enough, which means twilight can limit viewing during parts of the Arctic winter and eliminate it during the midnight-sun season. A bright moon does not stop a strong display, but it can wash out faint green arcs and make camera exposure more difficult. Moon phase, moon altitude, and the direction you are facing all affect how much the moon changes the experience.
In simple terms, the calculation works like this:
Live Aurora Score = aurora activity × local sky visibility × darkness conditions
This is not a universal scientific equation with fixed numbers. It is a decision framework. If the activity is high but visibility is near zero, the score should stay low. If activity is moderate, skies are clear, and darkness is excellent, the score can be very worthwhile for travelers near the auroral oval.
Why Location Changes the Score
A score that is useful in Reykjavík may be misleading on the Snæfellsnes Peninsula, where cloud patterns can be completely different. The same applies in Tromsø, Abisko, Rovaniemi, Fairbanks, and remote areas where a short drive may take you from cloud to clear sky.
Your latitude changes the activity threshold. Travelers close to the auroral zone do not need a major geomagnetic storm to see the lights. Those farther south may require higher KP values or stronger solar wind coupling before the aurora reaches their horizon. Local light pollution changes the threshold again: a faint arc may be visible to a camera outside town but invisible beside bright streetlights.
The viewing direction matters as well. During quieter conditions, aurora may sit low in the northern sky. Choose a location with an open northern horizon, away from buildings, mountains, and bright lights. During stronger activity, the display can spread overhead, making a wide open sky more valuable than a perfectly north-facing view.
Read the Score as a Decision Tool
A high score means conditions support a serious attempt, not that the sky will be filled with fast-moving curtains the moment you arrive. Aurora behavior changes quickly. An active oval may brighten and fade in minutes, while a quiet-looking arc can suddenly intensify after a favorable change in Bz.
Treat a medium score differently depending on your plans. If you are already outside a city on a clear night, it may be worth waiting. If you are deciding whether to book a guided Northern Lights tour, a medium score with a promising cloud forecast can still be a good opportunity because experienced guides can choose darker locations and respond to changing conditions. If you are driving independently, prioritize a safe route with several potential clear-sky stops rather than chasing every forecast update.
A low score is not always a reason to give up. Check which part of the calculation is low. When clouds are the problem but solar conditions are good, moving to a clearer microclimate can make sense. When skies are clear but activity is weak, enjoy the stars, keep expectations realistic, and watch for a change in real-time data.
Common Errors When Checking Aurora Conditions
The first mistake is refreshing the KP Index and ignoring everything else. KP provides context, but it cannot tell you whether clouds are covering your valley right now or whether Bz has turned sharply south.
The second is reading one favorable solar metric in isolation. Fast solar wind with positive Bz may produce little visible activity. Negative Bz with low speed can still help, but the result may be subtle. The most useful signal comes from the pattern across several measurements and whether it persists.
The third is confusing forecasted cloud cover with a fixed outcome. Clouds move. Coastal weather can change rapidly, and local terrain can create gaps that broad regional maps miss. Continue checking conditions through the evening, particularly if your itinerary gives you flexibility.
The fourth is expecting aurora to look exactly like long-exposure photographs. Human eyes often see pale green, gray-green, or soft white at first. A camera may reveal more color because it gathers light over several seconds. Give your eyes time to adjust, avoid phone screens, and look for movement or a growing arc rather than waiting for an instant neon display.
Use Live Data Without Losing the Night
The goal is not to stare at numbers all evening. It is to use the data to make one good decision, then stay alert for changes. Check activity, clouds, darkness, and weather before leaving. Once you are at a safe dark location, scan the sky regularly and reassess if conditions shift.
AuroraVision brings these moving pieces together in its free app, combining Live Aurora Score, solar wind, IMF Bz, KP Index, cloud cover, moon phase, weather, and alerts in one viewing-focused forecast. That matters when you have one clear night in Iceland or a short Arctic road trip and need an answer that is more useful than a single global index.
Set a realistic viewing window, dress for a longer wait than you expect, and keep a backup location in mind if clouds arrive. The best aurora nights often reward travelers who are prepared before the score improves. When the sky clears and the data turns favorable, you will be ready to look up instead of starting from scratch.